
Financial Statement Analysis:
It is the process of analyzing the financial statements of the company or organization. These are used in the decision-making process. It helps the external stakeholders to evaluate the performance of the company. It helps in understanding the overall condition of the company. The departments and employees inside the company use 3 tools of financial statement analysis to monitor the flow of finances.
Financial Statement analysis evaluates the performance of the company by using balance sheets, income statements, and cash flow statements. So we say that both internal and external stakeholders use 3 different tools of financial statement analysis to assess and monitor the performance of the company.
Objectives of Financial Statement Analysis:
Following are the objectives of financial statement analysis
- Provide necessary information that helps in decision making
- Know the company’s current position
- Remove discrepancy
- It minimizes the risk of fraud
Types of Financial Statements That Form the Basis of Financial Statement Analysis:
To manage the activities and operations of the business, companies use balance sheets, income statements, and cash flow statements. They make an analysis of this financial statement to provide clarity to their stakeholders with the help of 3 or more tools. Moreover, these statements are interlinked with each other. Additionally, it provides a complete view of the performance and activities of the company.
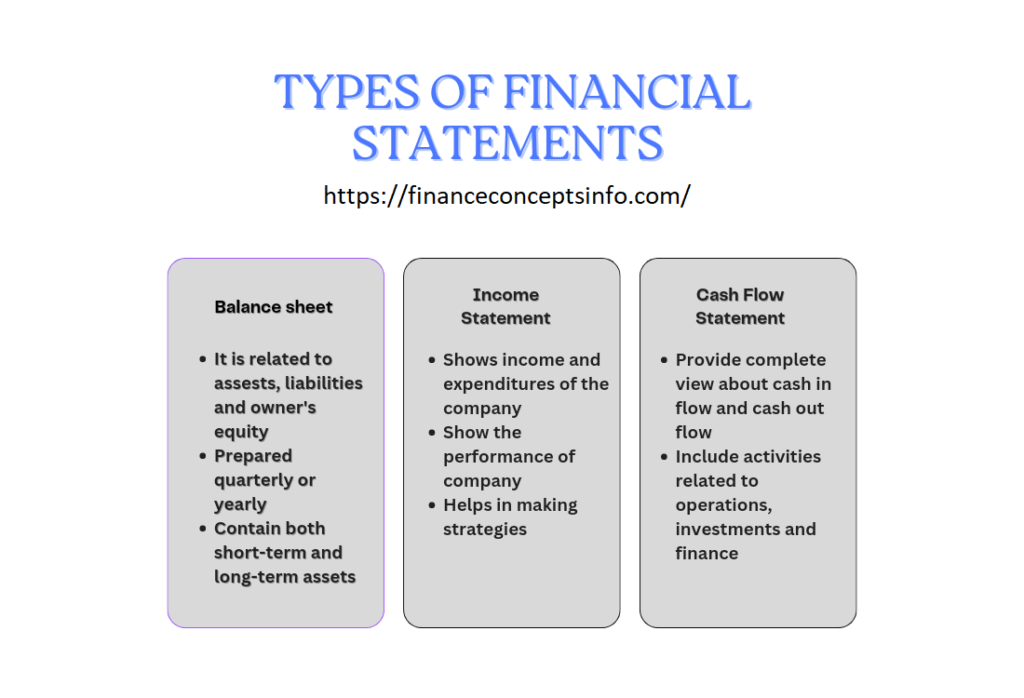
● Balance Sheet:
The most important financial statement for any company is the balance sheet. In addition, it is a statement that is related to assets, liabilities, and owner’s equity of the business and is called a balance sheet. Consequently, it is prepared at the end of the fixed duration. It may be prepared quarterly or yearly. It consists of two columns. The column on the left side is the assets of the company and the column on the right side is the liabilities and owner’s equity of the company.
Companies use financial statements to make effective decisions. It contains both short-term assets and long-term assets. For this purpose, companies make balance sheets to measure the risks associated with their activities. Balance sheets are used to balance assets and liabilities that are equal to the owner’s equity.
● Income Statement:
A financial statement that shows the income and expenditures of a company is called an income statement. Moreover, it shows the performance of a company over a period. It provides a complete view of the profit or loss of the company. Furthermore, it helps the owners of businesses to make strategies that help them to increase their revenues. However, the basic analysis of the income statement includes operating profit margins, gross profit margins, and net profit margins. Each profit is divided by the revenue.
● Cash flow Statement:
It is a key element for all companies. It provides a complete view of how cash entered and left the business. As a result, cash flow statements use to manage finances by having an eye on the cash flows of the company. This is because cash flow statements provide a complete and clear overview of the cash flow activities of the company. It includes activities related to operations, investments, and finance. Operating activities include finance use in operations. Investing activities include cash flows of investments. Financial activities include cash flows of debt and equity.
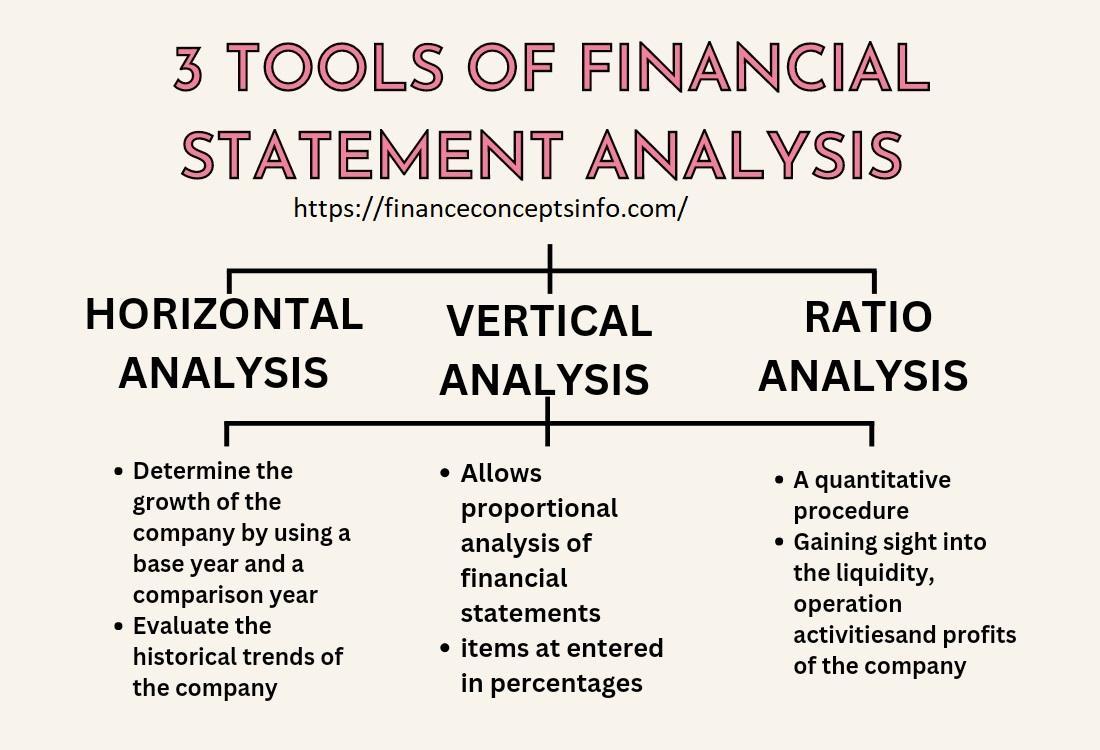
3 Tools of Financial Statement Analysis:
Financial Statements are used by companies to record their financial data that is related to all activities and operations. Most companies evaluate their performance based on their past and current projects. Companies make accurate and precise financial statements to get desired results. Many techniques and tools are used to do financial statement analysis but here we will discuss only 3 tools. By using these tools, investors develop a complete and clear picture of the financial state of a company. The 3 popular tools of financial statement analysis are:
- Horizontal Analysis
- Vertical Analysis
- Ratio Analysis
1. Horizontal Analysis:
Horizontal analysis is used to compare historical data or financial information over several reporting periods. These are used to check the growth of the companies in several periods. Because it helps in comparing the growth and financial position of the company with competitors. Additionally, it measures and evaluates trends year over year or quarter over quarter. For investors, End-year financial statements are not enough to invest in the company. Investors need financial statements of many years and compare them to evaluate the results.
A horizontal analysis tool is one of the 3 financial statement tools that is used to determine the growth of the company by using a base year and a comparison year. Analysts use this tool to evaluate the historical trends of the company. Financial Statements of companies give a complete and detailed picture of the performance of activities and operations of the company. It also provides complete information about the problems and strengths of the company. Analysts do a horizontal analysis of financial statements to get the results. The results determine whether a company is generating revenues or not. Its performance is good enough to survive in the market or not.
Analysts use horizontal analysis to compare the growth and profits across many firms but in the same industry over a particular period. In simple words, we say that analysts use this technique or tool to evaluate the past performance of the company and existing financial growth. The analyst projects their findings to gain profits.
2. Vertical Analysis:
Vertical analysis is an accounting tool that allows proportional analysis of financial statements. In vertical analysis, the items on the financial statements are entered as a percentage of the other item. Every entry in the balance sheets is not entered in the currency but it can be entered as a percentage of assets. It is used for a single reporting year that is held quarterly. It helps the company to observe the changes over a given period.
In this method or tool, analysts use percentages to gather data and do comparisons that are easier to understand. These percentages are used to represent line items. These are proportionately compared account balances of one company to another company.
It is a correlation between single items on the balance sheet and the bottom line. The bottom line is expressed in percentages. It helps analysts to compare the financial statements of one company with another. It also compares them across industries. With the help of this, analysts can view the relative proportion of accounts. With the help of vertical analysis, it is very easy to compare previous years’ quarterly to achieve good performance.
3. Ratio Analysis:
A quantitative method of gaining insight into the liquidity, operational activities, and profits of a company by studying its financial statements is called ratio analysis. The financial statement consists of balance sheets, income statement cash, and cash flow statements. Ratio analysis helps the analysts to view how the company is performing over the period. It compares one company with another company within the same sector. It is also required by external parties to set the benchmarks that are associated with risks.
However, investors as well as analysts use ratio analysis to determine the financial position of a company. For this purpose, they use recent and past financial metrics to evaluate the results. Examples are the current ratio, gross profit margin ratio, and inventory turnover ratio.